Reading Skew-T Log-P Upper Air Soundings
This
is a re-write of Richard Kellerman's article, "Understanding
Thermodynamic Diagrams" featured in Soaring Magazine. The goal
was to make it easier to understand for students by indentifying and explaining a few additional key concepts. --Andrew Kriz 02/12/2013
Perhaps the
greatest confusion from reading and understanding Skew-T charts is the
multitude of similar overlapping lines with funny names that might as
well be jibberish to student soaring pilots. This leads one
believe that these charts are beyond understanding, however, the lines on the chart are just graphical representations of
concepts in temperature changes with altitude with which many students
are already familiar.
The most important concept to recall when reading Skew-T's and this article:
A thermal will continue to rise as long as it stays warmer than the air outside of and surrounding the thermal.
When a thermal leaves the ground it is treated as a "parcel" by the Skew-T chart. The best way to imagine a thermal parcel is to imagine a bubble rising in a lava lamp. Once the thermal parcel leaves the ground then it is no longer heated by the ground and is isolated from all heat sources, so it rises only on the merit of being warmer and lighter than air surrounding the thermal. A hot air balloon functions the same way...
First before describing how to read the chart it's important to outline important concepts for final comprehension:
- The temperature lines are skewed on a Skew-T chart, as in they're not
vertical. How about that? So that's what the name stands for!
- When a thermal leaves the ground it's temperature decreases steadily with an increase in altitude, dry adiabatic lapse rate.
- The dewpoint of a thermal decreases steadily with an increase in
altitude, but slower than the temperature (aka a thermal's temperature and dewpoint
converges). This decrease of dewpoint with altitude is called mixing ratio.
- When the temperature and dewpoint of the air in the thermal become
equal then condensation occurs and a cloud will form. Cumulus form at cloudbase!
- If the thermal stops rising before it's temperature and dewpoint are equal then no cloud will form. It'll be a blue day!
- When a cloud condenses, the rising air in the cloud cools at a different and slower rate than the thermal that formed it.
Now to expand upon the numbered concepts and match them to Skew-T chart examples...
Concept 1:
The temperature axis is skewed in a Skew-T chart, as in it's not
vertical. How about that? So that's what that stands for!
Refer to Fig 1 below for this concept section...
The vertical axis generally shows an increase in altitude and a drop in
pressure as one follows the axis upward. Specifically, the
vertical axis is in units of pressure in hectopascals (hPa) which can
be directly converted to pressure altitude while assuming a standard
atmosphere. This means the chart always assumes a pressure of
29.92inHg (1013.25hPa) when at sea level, 0ft pressure altitude.
The reader may notice that pressure drops very quickly with a steady
increase in altitude within the first 18,000ft, this is the logarithmic
relationship started in the chart's title. Enter a corny joke...
What is a half-astronaut? A pilot flying at 18,000ft, because the atmospheric
pressure is half of sea level's.
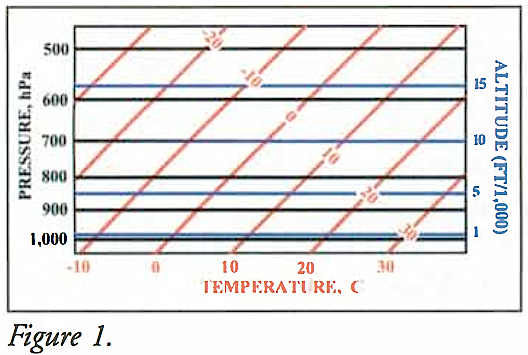
Other handy hPa to altitude conversions...
- 1013.25hPa --> 0ft
- 850hPa --> 5,000ft
- 700hPa --> 10,000ft
- 500hPa --> 18,000ft
The horizontal
axis shows a increase in temperature when read left to right.
However now look at the below figure... Notice how the red lines
eminating from the temperature are not vertical? Instead the
temperature lines are move diagonally to the right and up. Why
did they choose to do this? Because if the line was vertical the
chart would be very very wide and not fit on a normal sheet of paper.
So, if you took temperature readings in a glider while climbing you'd plot them as follows.
- At 0ft it's 30deg C. Plot a point where the 30deg C line and 0ft line meet.
- At
5000ft it's 15deg C. To plot 15deg C, draw an imaginary line between
and parallel to the 10deg and 20deg lines. Plot a point where your new
15deg line and 5000ft line meet.
Concept 2: it's temperature decreases steadily with an increase in altitude.
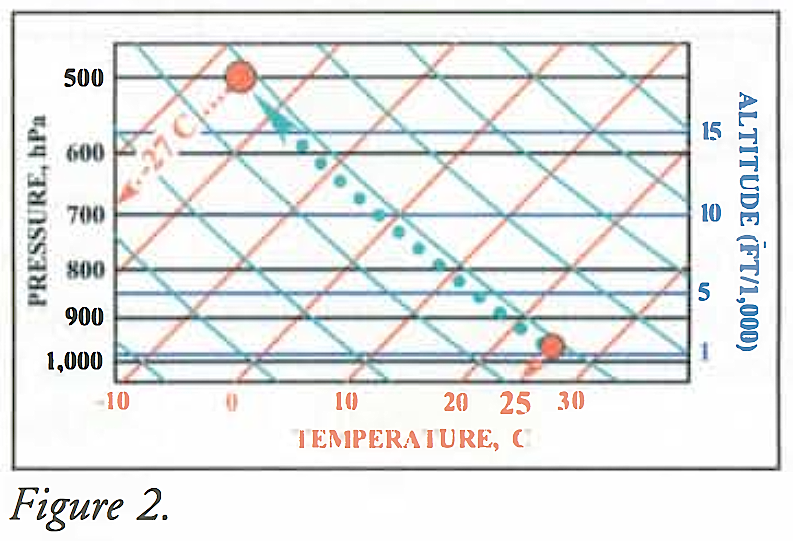
When a thermal
leaves the ground it's
temperature decreases steadily with an increase in altitude. The
same
thing would happen to the air inside a hot air balloon as it climbs,
without the burner running.
Why is this so? Because thermodynamics says so. More
specifically, the hydrostatic equation, ideal gas law, and a few others describe these characteristics of the atmosphere which are beyond the scope of this article.
This relationship is shown on a Skew-T with a line labeled "Dry Adiabatic Lapse Rate" (DALR).
- The "dry" means it's exlcuding any water vapor effects.
- "Adiabatic" means there is no energy added or removed from the
air, i.e. the air is not being heated or cooled by anything, so in this
case all of it's temperature changes are due to pressure changes.
The pressure changes occur with changes in altitude.
- "Lapse rate" means how the temperature changes with altitude.
In Fig 2
the DALR is shown as a cyan blue line moving diagonally left and
up. If a thermal was proposed to start at a temperature of 25deg
C at 1500ft then as is rises it'd cool and eventually reach -27deg C at
18,000ft as indicated by the dotted cyan line. EVERY thermal that
begins to rise will follow a line parallel to the DALR line and cool as
it rises accordingly.
Concept 3: The dewpoint of a parcel of air in a thermal decreases steadily as it climbs in
altitude, but slower than the temperature (aka temperature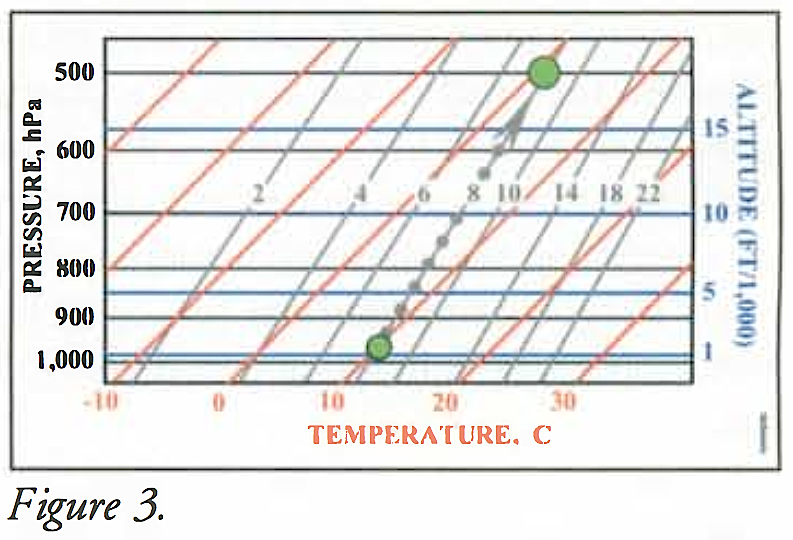 and dewpoint
converges).
and dewpoint
converges).
This
relationship is shown by a series of grey diagonal lines running
right and up called "Lines of Constant Mixing Ratio". Notice
they're a little closer to vertical than the red constant temperature
lines, this is any easy way to distinguish them.
Notice in Fig 3 the DALR lines are removed so it's easier to see the
mixing ratio lines. In Fig 3 the green circles and
dotted grey line show how the dewpoint of a thermal air parcel would
change as it rises. In this example a thermal starting at 1500ft
with a 10deg C dewpoint would change to a 0deg C dewpoint when reaching 18000ft.
Concept 4: When the temperature and dewpoint of the air in the thermal become
equal then condensation occurs and a cloud will form. Cumulus cloudbase!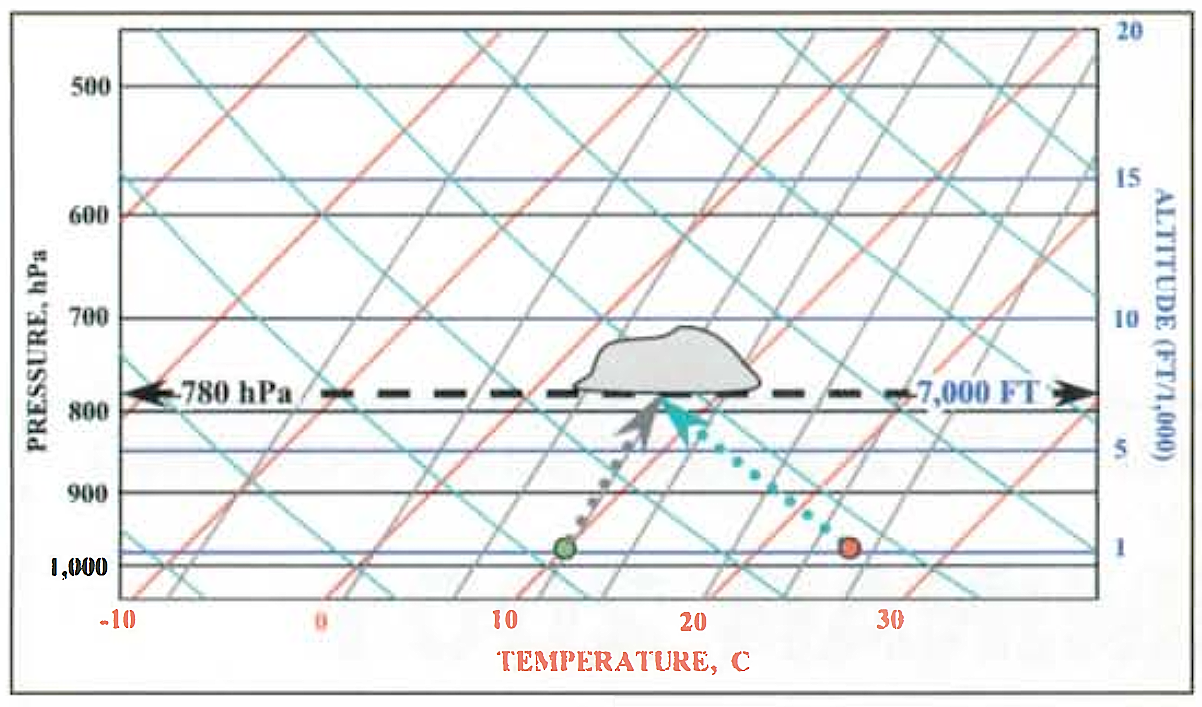
Now concepts 2
and 3 can be combined to show at what altitude cloudbase will form
given the same example starting temperatures at 1500ft (25degC and
10deg dewpoint).
Starting at
1500ft, follow the DALR (dotted cyan) up and left from 25deg C and follow the
Constant Mixing Ratio (dotted grey) up and right from 10deg C dewpoint. Where
they eventually meet indicates temperature equals dewpoint and
therefore a cloud must form. When the temperature and dewpoint of the air in the thermal become
equal then condensation occurs and a cloud will form. Cumulus cloudbase!
If you found and
stood in the base of a thermal on the ground and measured it's
temperature and dewpoint then you can determine the altitude of the
thermal's cumulus cloud directly over your head.
Concept 5: If the thermal stops rising before it's temperature and
dewpoint are equal then no cloud will form. It'll be a blue day!
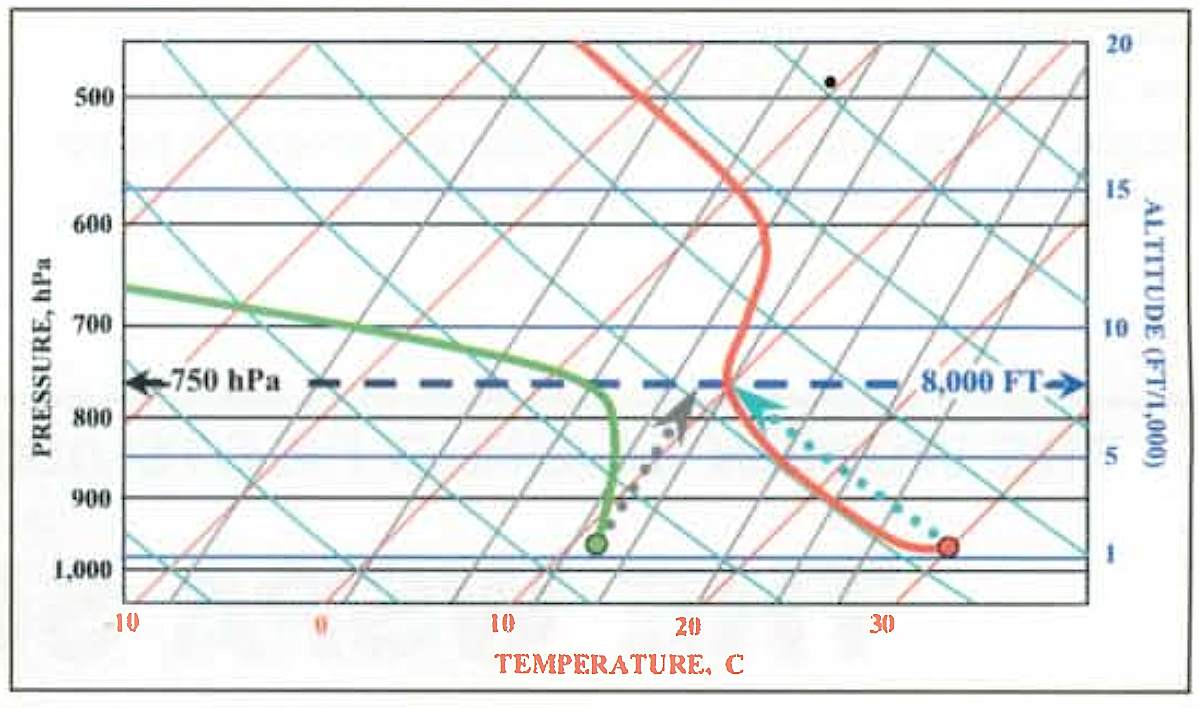
In the below
figure the same background DALR and mixing ratio lines are carried
over. Also, notice the addition of the green and red lines. The
red line shows the actual temperature of the air with respect to
altitude as a weather balloon would measure it. The green line
shows the actual dewpoint with respect to altitude. These lines
show the temperature and dewpoint of the air OUTSIDE the thermal, in
other words "ambient" temperature and dewpoint.
Notice how the
actual temperature and dewpoint lines do not follow the DALR and mixing
ratio lines? Recall the DALR and mixing ratio lines only describe
how a thermal behaves not the air outside the thermal.
In the figure
the thermal lifts off at the "red dot" from 1500ft at 30degC and rises
to 8000ft according to the DALR shown by the dotted cyan line.
Notice how the thermal's temperature along the DALR stays higher than
ambient air's red line? This fact is quickly observed by how the
thermal's line stays to the right of the ambient air's line at a given altitude. What
does this tell us? It says a thermal will only continue to rise as long as it stays warmer than the air outside of and surrounding the thermal.
Now to study the
dewpoint relationships. The thermal lifts off at the "green dot"
from 1500ft at a dewpoint of 12degC which cools along the dotted grey
mixing ratio line until 8000ft. Why does the dewpoint change stop
at 8000ft? Because it has already been observed the thermal can no
longer rise. Since the thermal's dotted cyan DALR line and dotted
grey mixing ratio line don't intersect then a cloud cannot form. If the thermal stops rising before it's temperature and
dewpoint are equal then no cloud will form. It'll be a blue day!
Concept 6: When a cloud condenses, the rising air in the cloud cools at a different rate than the thermal that formed it.
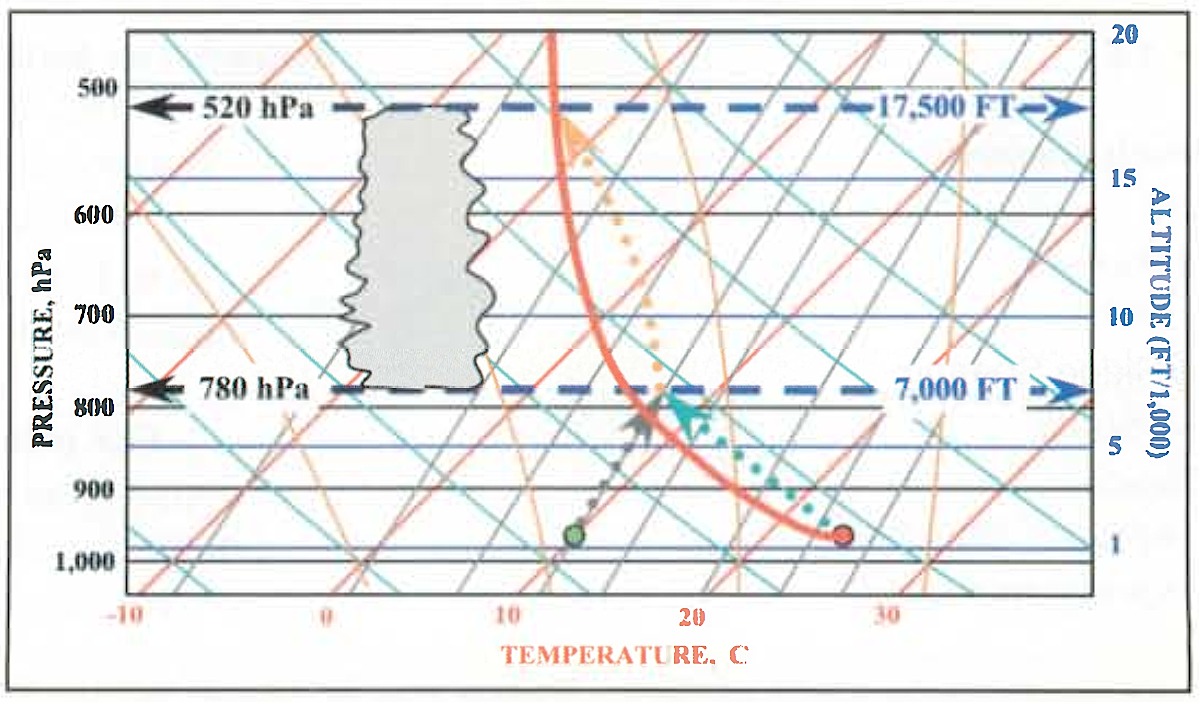
Now to study a
tall cumulus day as illustrated in the figure. In this example
the thermal's temperature starts at 25deg C at 1500ft and it's dewpoint
starts at 10deg C. Unlike the last example, the thermal's DALR
and mixing ratio lines are allowed to converge, therefore a cloud will
form. The likelyhood of cloud formation can be quickly determined
by the spread or spacing between the actual temperature and dewpoint
lines. The closer they are together the more likely clouds will
form and lower cloud bases will be...
A new line
introduced in this example is the curving dotted orange line, called the
Saturated Adiabatic Lapse Rate (SALR). What makes this different
from the DALR? The word saturated means it only applies to a
condensed clouds air parcel. So, the SALR line shows how the
temperature of a cloud's rising parcel changes with altitude (also
pressure). When a cloud condenses, the rising air in the cloud cools at a different rate than the thermal that formed it.
With this knowledge, it's possible to determine how tall the cumulus cloud will grow
by observing how long the dotted orange SALR line remains to the right
of the red temperature line. It is important to remember the
parcel of air following the dotted orange line is still the same parcel
of air that started as a thermal bubble on the ground, except now it is
also a cloud. Eventually, the dotted orange SALR line intersects
the red ambient temperature line, so the cloud will no longer rise and
evaporate/dissipate at 17,500ft.
Conclusion
Hopefully this helped clear up Skew-T diagrams a bit. One way to
learn them better is to look at a sounding for a good soaring day and
take the forecast high temperature and corresponding dewpoint and draw
the DALR and constant mixing ratio lines emanating from them
respectively. With practice this can be done purely mentally by glancing at a Skew-T chart. Also, with practice one can begin to connect recurring patterns in the charts with certain types of soaring days. A future article will cover these patterns to help make it easier to identify a inversions, weak days, strong days, blue days, thunderstorm potential, cumulus spread out potential, etc.
This
is a re-write of Richard Kellerman's article, "Understanding
Thermodynamic Diagrams" featured in Soaring Magazine. The goal
was to make it easier to read for students.
Andrew Kriz
02/12/2013